The firm frames the study against a troubling backdrop. Citing reporting from CNN, the analysis notes that road rage incidents nationwide have increased fivefold over the past decade, a rise the firm characterizes as a genuine epidemic rather than an isolated nuisance. That behavior spans a wide range, from shouted insults and aggressive honking to the kind of physical confrontations and gunfire that can turn an ordinary commute fatal.
A Score Built From Two Kinds of Danger
The firm’s methodology treats road rage as a problem with two intertwined roots. One is behavioral: how often drivers in a given city engage in reckless maneuvers, confrontations, or acts of violence behind the wheel. The other is structural: how well or poorly a region’s highways, interchanges, and surface streets are designed to move the volume of traffic they actually carry. Researchers combined a Commute Time Score, Commute Dissatisfaction Score, Inefficiency Score, and Wasted Time Score with a Shooting Score and Reckless Driving Score to arrive at a single Total Road Rage Score for each of the 100 cities studied, arguing that gridlock and aggression are not separate phenomena but feed directly into one another.
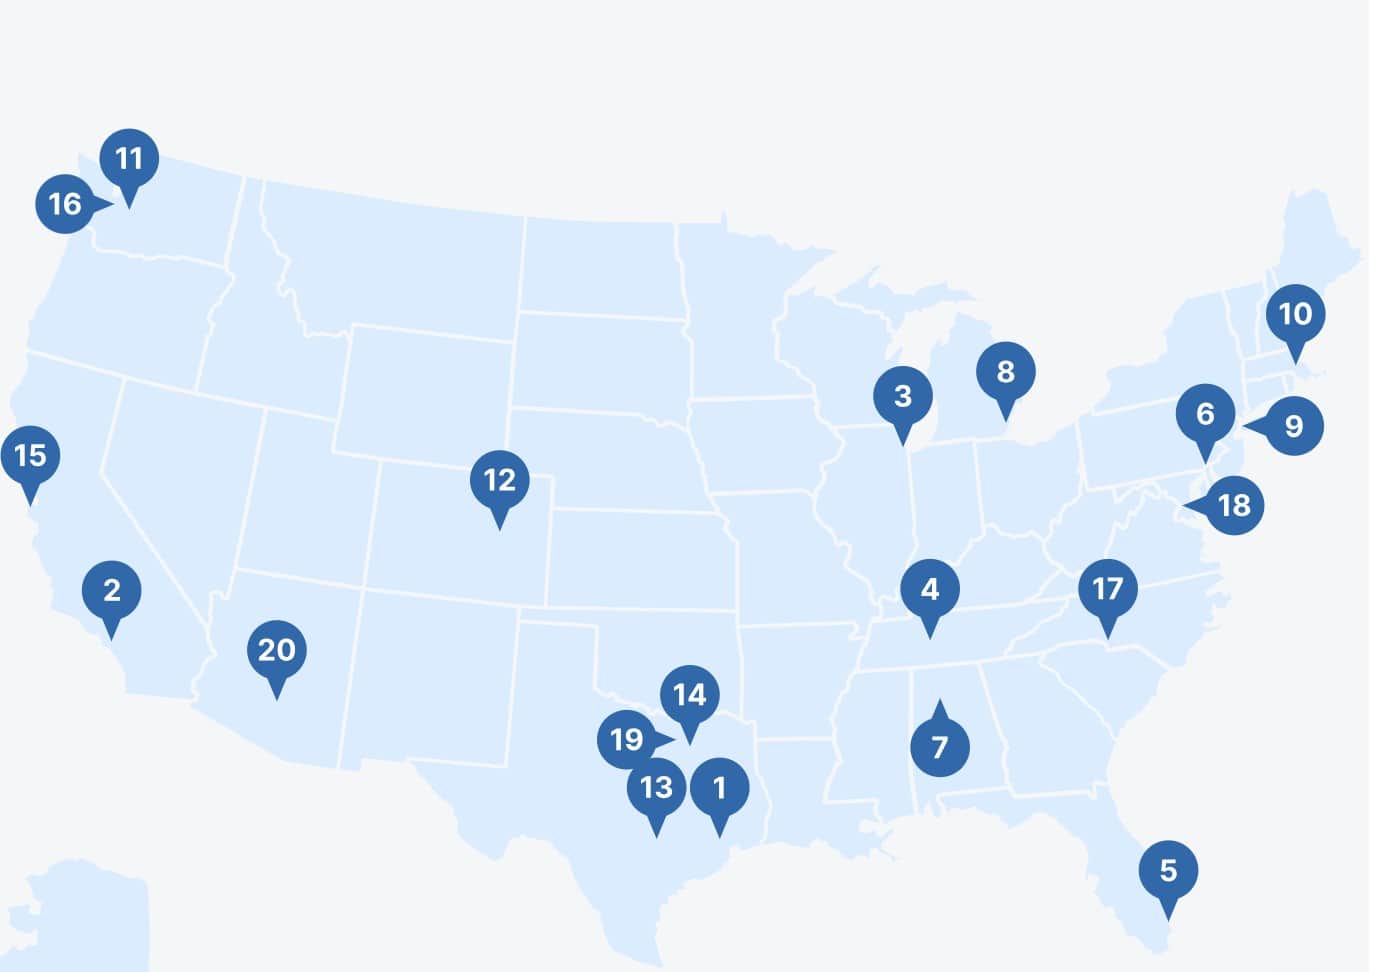
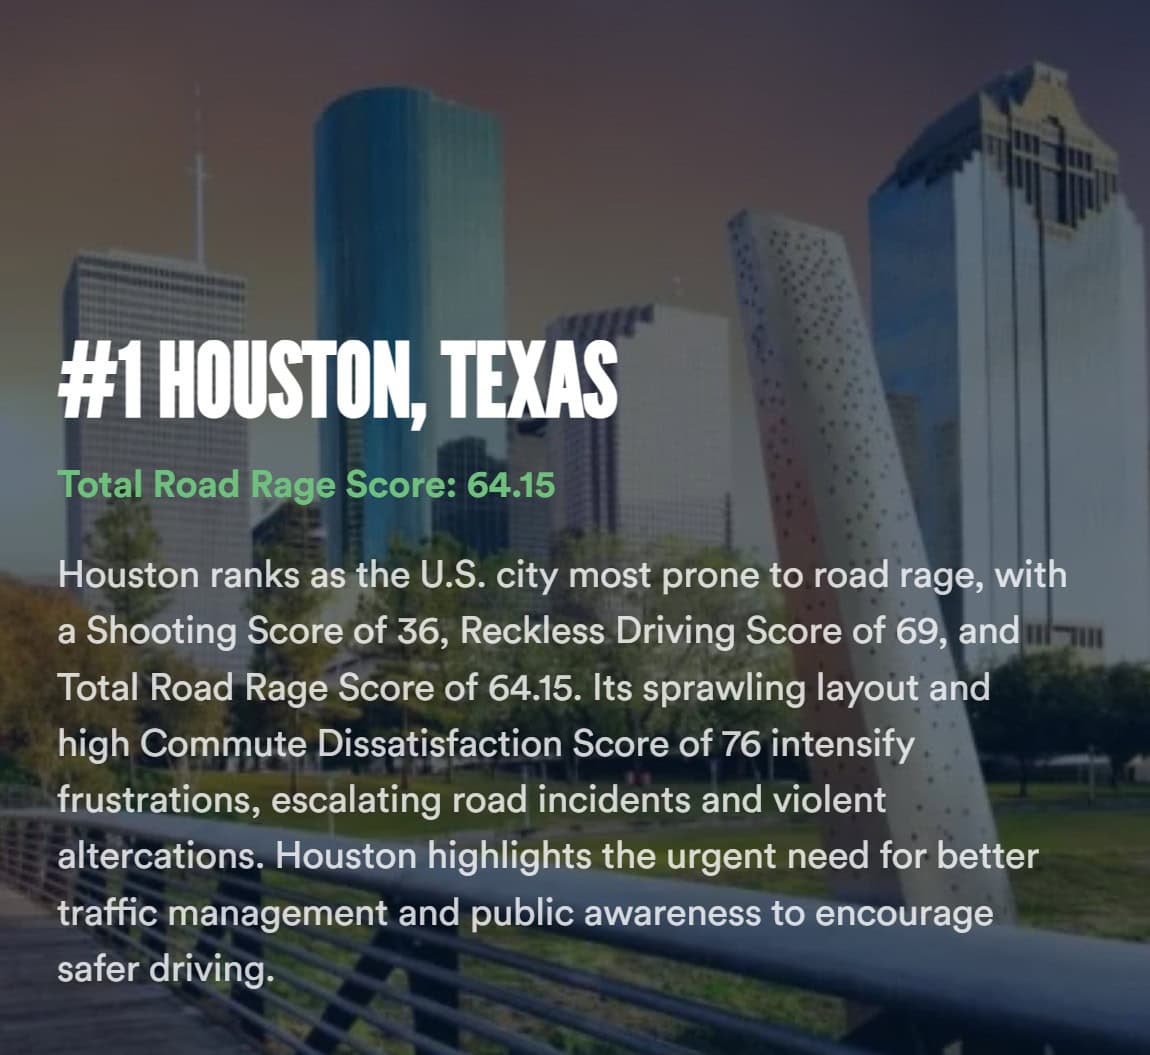
Houston topped the list with a TRRS of 64.15, driven by a Reckless Driving Score of 69 and a Shooting Score of 36, the highest of any metro area studied. That figure, the firm says, demonstrates how frequently roadway disputes in the Houston area escalate well past honking and tailgating into actual gunfire. Houston’s sprawling geography also produced a Commute Dissatisfaction Score of 76, a combination the study describes as intensifying frustration and pushing more incidents toward violence.
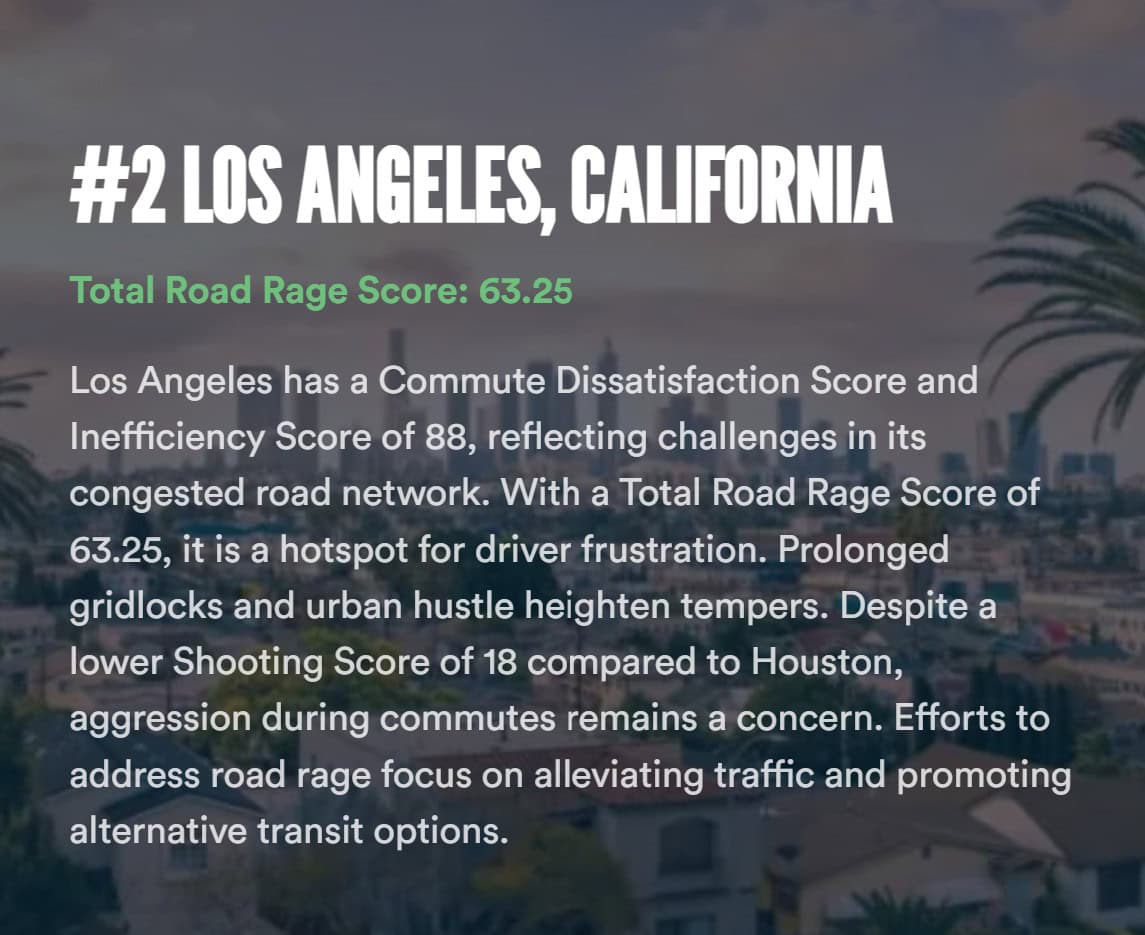
Los Angeles landed at number two with a score of 63.25, but the drivers of that ranking look different from Houston’s. Los Angeles and Houston are the only two cities in the entire 100-city dataset to score above 60. Rather than violence, the Los Angeles score is dominated by sheer gridlock: the city posted matching Commute Time, Dissatisfaction, Wasted Time, and Inefficiency scores of 88, among the highest such figures anywhere in the analysis. Its Shooting Score, by contrast, was a comparatively modest 18. The firm’s researchers argue that this kind of prolonged, grinding congestion erodes driver self-control over time, making otherwise minor provocations more likely to boil over, even where gun violence is rarer.
Rapid Growth, Aging Roads
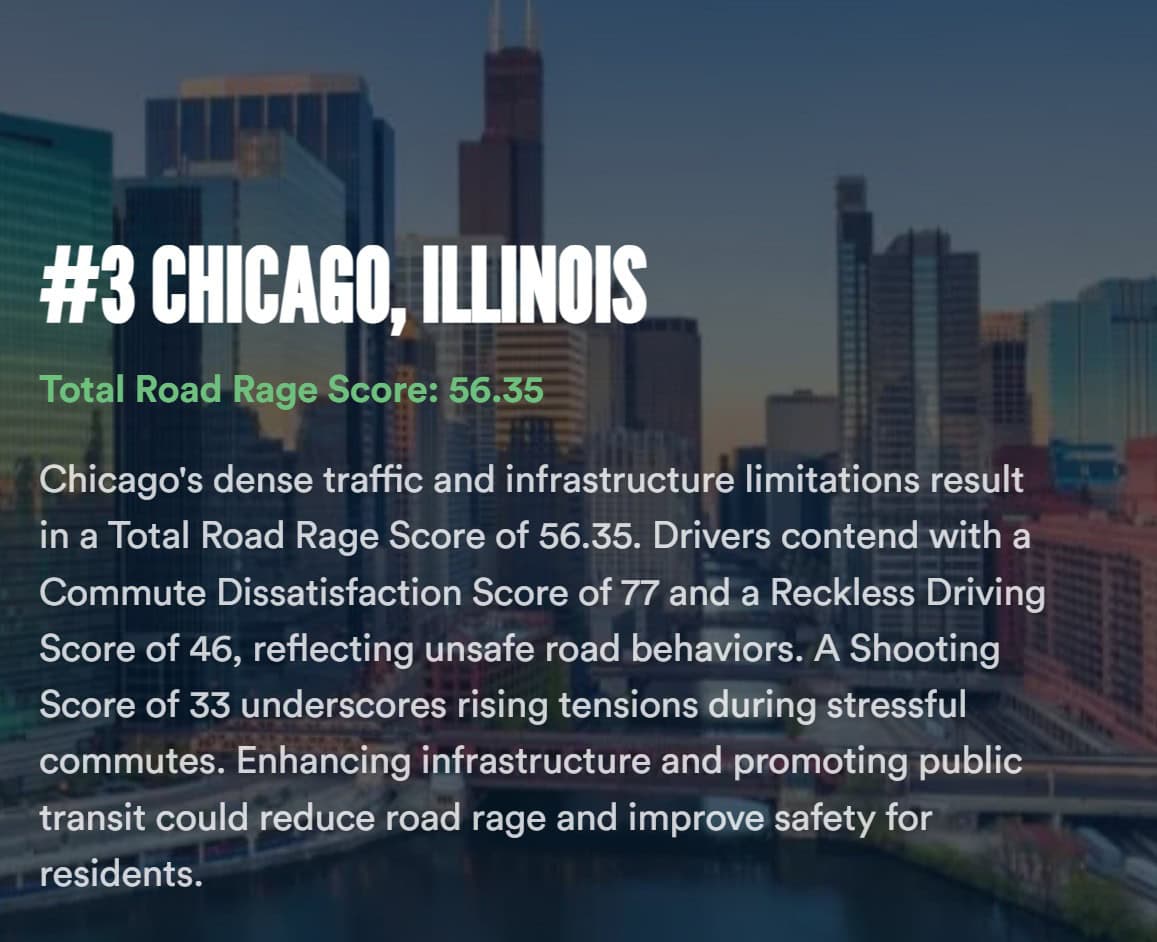
Chicago claimed the third spot with a score of 56.35, driven by a Commute Dissatisfaction Score of 77 and a Shooting Score of 33, the second highest in the country behind Houston. Nashville followed in fourth at 56.25, with a Reckless Driving Score of 63 layered on top of a Commute Dissatisfaction Score of 70. The analysis points to a pattern linking the two cities: both have experienced rapid population growth in recent years that has outpaced investment in road capacity and design. As new residents and commuters pour into metro areas whose highway systems were built for a smaller population, the resulting mismatch between demand and infrastructure becomes fertile ground for aggressive driving.
Miami rounded out the top five at 56.15, with an especially high Commute Dissatisfaction Score of 81 paired with a Reckless Driving Score of 43. Just behind the top five, Philadelphia, Atlanta, Detroit, New York City, and Boston filled out the rest of the ten most dangerous metro areas, each posting Total Road Rage Scores between roughly 51 and 56. Detroit stood out within that group for an unusual pattern: a Commute Dissatisfaction Score of 84, among the highest in the country, paired with a comparatively low Reckless Driving Score of 16, suggesting that in Detroit’s case, deteriorating infrastructure rather than aggressive behavior is driving the frustration. New York City, despite its extensive transit system, still posted a Commute Dissatisfaction Score of 82, though its Shooting Score of 6 was among the lowest of any major city studied.
Angel Reyes, founder and managing partner of Angel Reyes & Associates, said in a statement accompanying the release that the issues showing up on American roads have moved beyond simple traffic volume. He pointed to inefficient highway design as a driver of the split-second decisions that can turn dangerous or fatal, calling the findings a wake-up call and urging infrastructure reform to address the conditions that turn packed highways into safety hazards.
What’s Actually Fueling the Anger
The report devotes considerable attention to the mechanics behind rising road rage, describing it as the product of overlapping societal, psychological, and environmental pressures. Urban growth and worsening congestion lengthen commutes and heighten frustration on their own, but the study also points to distractions from in-car technology and smartphones as a source of driving errors that provoke conflict between drivers. Post-pandemic anxiety and broader economic stress compound the problem, as does what the firm describes as the normalization of aggressive driving behavior, amplified in part by social media.
Inconsistent enforcement of traffic laws plays a role as well, the analysis argues, emboldening drivers who face little fear of real consequences for reckless behavior. The report also cites the growing popularity of high-powered vehicles, emotionally charged music, and viral road-rage videos as smaller but compounding factors. Beyond behavior alone, the physical experience of driving matters: long stretches of stop-and-go traffic produce a distinct kind of commuting fatigue that wears down patience over time, while poorly maintained roads, sudden lane closures, unplanned detours, and severe weather each strip away a driver’s sense of control in ways that make minor provocations, such as tailgating or an unnecessary honk, far more likely to spiral into confrontation.
The Safest Roads Look Very Different
At the opposite end of the ranking, the analysis found a markedly calmer picture in the country’s smaller metro areas. Lincoln, Nebraska, posted the lowest Total Road Rage Score of any city studied, at just 1.50, with Sioux Falls, South Dakota, close behind at 5.00. Omaha, Nebraska, ranked third among the safest cities at 6.75, followed by Bakersfield, California, at 9.25 and Boise City, Idaho, at 9.45 to round out the five calmest metro areas in the country. The firm attributes those low scores to a combination of efficient road design, comparatively light congestion, and what it describes as a more patient regional driving culture, one less prone to the kind of escalation seen in larger, denser metro areas.
The contrast between the top and bottom of the list is stark enough to suggest that road rage, at least as measured here, is not simply a function of how many drivers are on the road, but of how well the roads themselves are built to handle them, and how quickly a region’s infrastructure has kept pace with its growth. Notably, several of the safest cities, including Lubbock and Corpus Christi in Texas, still posted comparatively high Reckless Driving Scores even while their overall Total Road Rage Scores stayed low, a reminder that lighter congestion does not always translate into universally cautious driving.
When Frustration Turns Violent
The report singles out the link between traffic stress and gun violence as one of its more alarming findings. Houston’s Shooting Score of 36 leads the nation, followed by Chicago at 33, Philadelphia at 30, Detroit at 29, and Phoenix at 31, with the firm attributing the pattern in each case to a mix of heavy congestion, reckless driving, and infrastructure that struggles to keep pace with demand. The study argues that prolonged stress, repeated delays, and erratic driving behavior create the conditions under which minor disputes, such as a driver being cut off or honked at, can escalate rapidly once emotions are already running high. Addressing that escalation, the report suggests, requires both better traffic infrastructure to reduce the delays that fuel frustration in the first place and broader driver education focused on de-escalation and anger management.
Context Behind the Numbers
The release arrives even as national traffic fatality data from the National Highway Traffic Safety Administration has shown some signs of improvement in recent years. Angel Reyes & Associates frames its city-level analysis as a necessary complement to that broader trend, arguing that national averages can mask serious, localized risks that vary dramatically from one metro area to another. For its data, the firm drew on figures from Numbeo, NHTSA, the Gun Violence Archive, and the U.S. Census Bureau to build out the scoring behind each city’s ranking.
The firm, which says it has spent more than three decades representing motor vehicle accident victims and has recovered more than $1 billion on behalf of clients, positions the study as an effort to close what it calls a national blind spot around road safety, one it argues persists until both commuters and city leaders understand the specific risks embedded in their own daily routes. Angel Reyes & Associates, which operates offices in Dallas, Houston, Fort Worth, and Austin, also represents victims of road rage and reckless driving incidents, offering free consultations to those pursuing compensation for injuries, property damage, and other losses tied to aggressive driving.
The full rankings of all 100 cities, along with an interactive regional risk tool and a detailed breakdown of the study’s methodology, are available on the firm’s website at reyeslaw.com.